
Credit unions and community banks, usually the lowest-cost lenders on our platform, moved from the low 6s to 7-8%+ in about six weeks. Here’s what 141 live lender quotes show, including one deal where quotes ranged from 6.35% to 13.90%, and what it means for the deals you’re placing.
In early August, the best quotes on LoanBase came from credit unions: 6.15% to 6.40% on five-year fixed commercial loans. By late September, the same lender group was quoting 6.50% to above 8.25%. Single-family rental loans from banks and credit unions now sit at a median of 7.48%, and 12 of the 14 we received in September came in at 7% or higher.
This isn’t a lender-specific story. The 5-year Treasury, which most of these loans are priced from, rose 62 basis points between August 10 and September 24. Lenders also widened their spreads on top of it. Meanwhile, multifamily CMBS delinquency has more than quadrupled in two years, and 17% of all commercial and multifamily mortgage debt matures this year.
From 6.15% to 8.25%+ in six weeks
We looked at every term-loan quote from a bank or credit union on LoanBase since late July: three- to ten-year fixed or hybrid loans, the cheapest capital most small-balance investors can get.
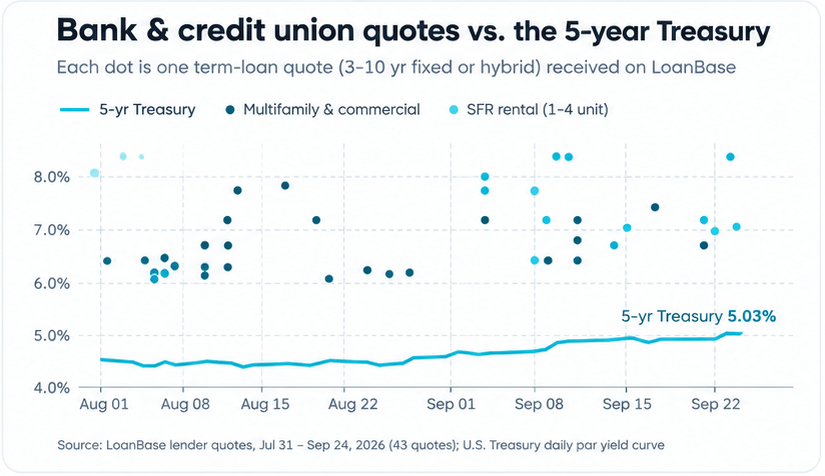
LoanBase lender quotes, Jul 31 – Sep 24, 2026 (43 bank & CU quotes) · U.S. Treasury daily par yield curve
| Bank & credit union term loans | August median | September median | Change |
| Credit unions only (Sept. includes SFR) | 6.35% (n=7) | 7.05% (n=8) | +70 bps |
| Multifamily & commercial | 6.35% (n=20) | 6.93% (n=8) | +58 bps |
| Single-family rentals (1-4 units) | – | 7.48% (n=14) | – |
The September SFR quotes came from banks and credit unions in Florida, Kansas, Louisiana, Texas, Virginia and Wisconsin. They ranged from 6.50% to 8.26%. The only two below 7% were a 5-year option at 6.50% (Wisconsin) and a 10/6 ARM at 6.75% that required the borrower to take title in their personal name, not an LLC.
Same lenders, higher prices. Three lenders that quoted us more than once show the move directly:
- Same deal, same credit union (Kansas SFR). On September 4, the lender said pricing would be about 300 bps over the 5-year Treasury, roughly 7.5% that day. On September 23, it came back at 350 bps over, and said the rate would be above 8.25%. The index rose 45 bps in those three weeks, and the lender added 50 bps of spread on top.
- A Texas credit union, on comparable retail and mixed-use deals, went from 6.25-6.35% in late August to 6.50% on September 11 and 6.75% (10-year term) on September 21.
- A Midwest credit union quoted 6.675-7.5% on a five-year fixed on September 15 and told us plainly: “Rates did however have some significant increases.”
The rate sheet isn’t the rate. A national DSCR debt fund’s flyer raised its “starting at” rate from 5.00% on August 7 to 5.75% on September 19, and its fix-and-flip floor from 9.24% to 9.49%. Deal-specific quotes from non-bank DSCR and stated-income lenders ran much higher than those floors: a median of 9.12% (n=21, range 6.38-11.74%).
58 bps higher: 40 from Treasuries, 17 from lenders
Most bank and credit union investor loans are priced as a spread over the 5-year Treasury. The term sheets we received used 225 to 350 bps over that index. The index itself has repriced sharply:
- 5-year Treasury: 4.41% on August 10, 5.03% on September 24 (+62 bps). It started the year at 3.74%.
- 10-year Treasury: 5.11% on September 23, the highest since July 2007, and 5.18% on September 24. It started the year at 4.19%.
- Fed funds: On September 16 the Fed raised its target range by 25 bps to 3.75%-4.00%, its first hike since 2023. The median projection shows one more increase this year, and markets price more into 2027.
The arithmetic is simple. With the 5-year at 5.03%, the spreads our lenders quoted produce 7.28% at +225 bps, 7.78% at +275 bps and 8.53% at +350 bps, before fees. That’s why a borrower whose loan was quoted at 6.4% in August can’t expect the same number today, even from the same lender.
How much is the Treasury, and how much is the lender? On multifamily and commercial bank quotes, the median rate rose about 58 bps from August to September. Roughly 40 bps of that came from the 5-year Treasury. The other ~17 bps came from lenders widening their spread, from a median of 195 bps to 212 bps over the index. Single-family rentals carry a much wider spread, about 290 bps, which is why they now price in the mid-7s even at banks and credit unions.
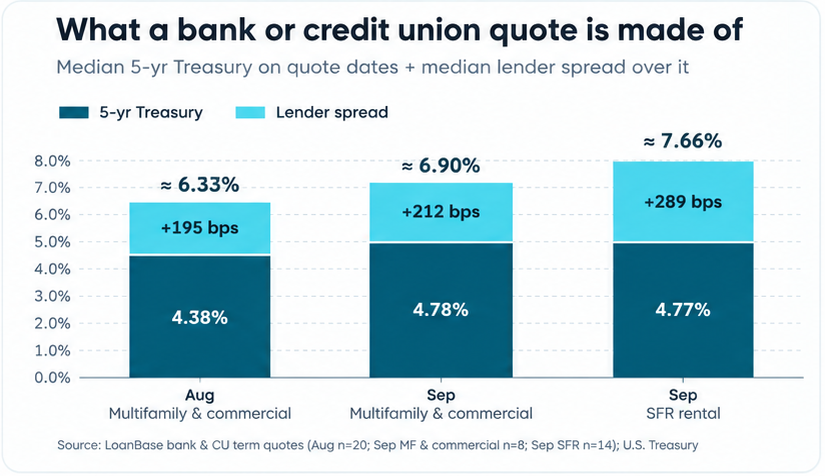
LoanBase bank & CU term quotes (Aug n=20, Sep MF & commercial n=8, Sep SFR n=14) · U.S. Treasury par yield curve
For context, large-balance lenders are pricing below the small-balance bank market. As of September 22, Northmarq showed Freddie Mac multifamily at 5.73-6.52%, Fannie Mae at 5.83-6.80%, life companies at 6.12-7.30% and CMBS at 6.82-7.34%. A small single-family rental portfolio financed at a local credit union now often pays more than a large agency-financed apartment deal.
By property type: banks show up for multifamily and retail, and hotels go private
Across every property type where both banks and private lenders quoted, bank and credit union money was 180-375 bps cheaper. Which one your borrower lands depends mostly on the asset and how you present the deal.
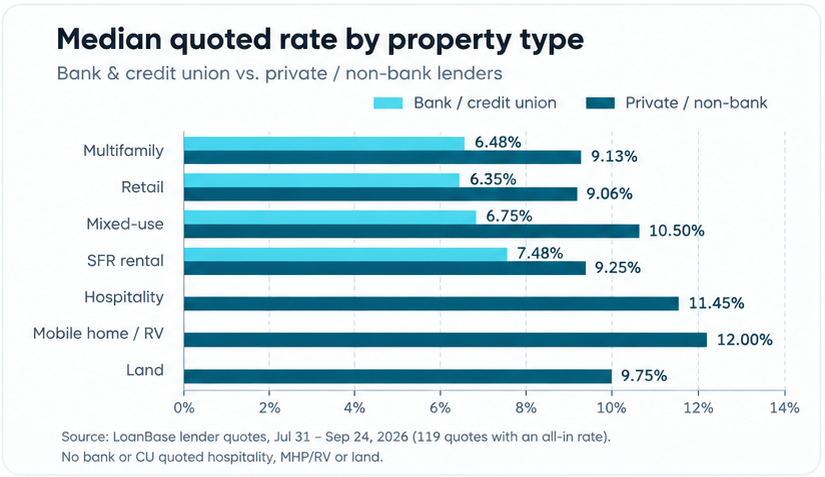
LoanBase quotes by property type, Jul 31 – Sep 24, 2026 (119 quotes with an all-in rate)
- Multifamily (9 deals, 19 quotes). Stabilized multifamily is still the best-priced asset we see. Bank and credit union quotes had a median of 6.48%; private quotes, 9.13%.
- Retail (7 deals, 28 quotes). Our most-quoted property type. Banks and credit unions quoted a median of 6.35%, in line with multifamily. But 20 of the 28 quotes came from private lenders at a median of 9.06%, mostly on smaller or cash-out refinances.
- Mixed-use (3 deals). Bank and credit union quotes had a median of 6.75%; private quotes, 10.50%.
- Hospitality (4 deals, 6 quotes). No bank or credit union quoted a hotel. Private quotes ran from 9.00% to 14.95%, with a median of 11.45%. The one institutional hotel lender that replied indicated SOFR + 500s, about 8.7% today. It also said it would not consider a cash-out without two years of trailing cash flow.
- Office and industrial. We had one deal of each, and only private lenders quoted: office at 11.74-13.95% and industrial at 9.00-10.70%. That’s too few to draw conclusions about either sector.
The spread between lenders on a single deal can be larger than any market move. Stabilized multifamily refinances drew tightly clustered bank quotes. Deals that fell between bank and private lending drew offers five to seven points apart:
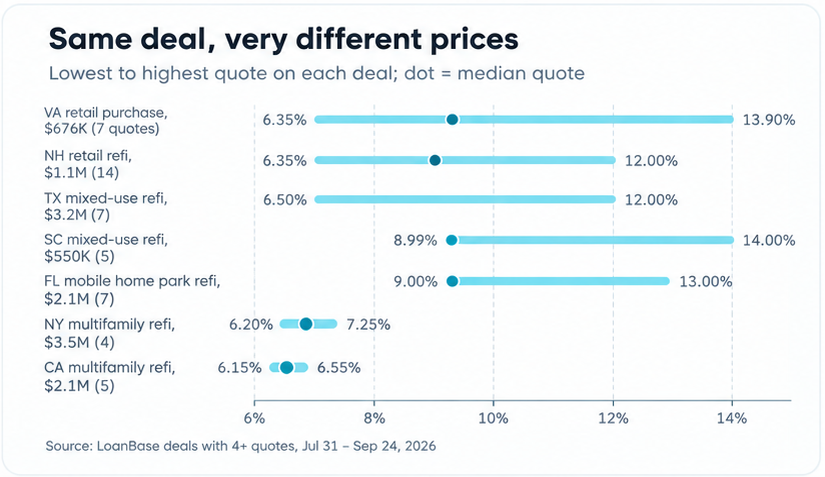
LoanBase deals with 4+ quotes, Jul 31 – Sep 24, 2026
For the same Virginia retail purchase, the lowest quote was 6.35% and the highest was 13.90%. The best way to get a lower rate right now is to put the deal in front of the right lenders, not to wait for Treasuries to come down.
Proceeds are shrinking: 14% less loan on the same NOI
The coupon gets the headlines, but the other terms decide how much a borrower can actually borrow.
Shorter amortization. Most bank and credit union term sheets in September used 20- or 25-year amortization, not 30. One bank said directly that it “will not be able to accommodate a 30-year amortization.” At 7.25%, moving from a 30-year to a 20-year schedule raises annual debt service from 8.19% to 9.49% of the loan balance. At the same DSCR, that means about 14% less loan.
Rate and amortization together. A typical August quote was 6.35% on a 30-year schedule. A typical September quote is 7.25% on a 25-year schedule. With the same NOI and a 1.25x DSCR test, the September terms support about 14% less proceeds. That’s equity your borrower has to bring to close, and it’s better to have that conversation before the term sheet than after it.
Tighter leverage and cash-flow tests. One lender told a borrower asking for 80% LTV on a large single-family home that 80% was not close to realistic: even at 55% LTV, interest-only, the deal reached only a 1.0 DSCR at 6.75%. A credit union calculated that a North Carolina multifamily refinance would need about $145,000 of NOI after a 10% vacancy haircut and a 5% maintenance reserve. Another credit union questioned whether a Virginia rental could support the requested loan at all.
Relationship and geography requirements. Low rates increasingly come with conditions:
- a $50,000 deposit balance with the lender
- all rents collected through the bank, plus a request to move a $3.7M brokerage account
- “a deposit relationship would be required”
- two Louisiana banks said they have low appetite for out-of-state sponsors
Hidden costs. Examples include a 2.5% exit fee if the borrower refinances with another institution during the term, a 3-2-1 prepayment penalty, and a 25 bps higher rate for brokered loans (7.375% vs 7.125%) at one credit union.
When the bank says no: 10.5% median and 2 points
Borrowers who don’t fit a bank or credit union box, because of transitional cash flow, a cash-out request or a harder asset type, end up in the private market. That market is much more expensive.
- 55 bridge and private-lender quotes had a median rate of 10.50%. The middle half fell between 9.00% and 12.00%, and 35% were at 12% or higher.
- Origination fees had a median of 2.0 points (n=38), and several lenders asked for 6-7 points. Examples: a Florida mobile home park bridge at 12.90% plus 7 points, and a Texas hotel refinance at 12.00% plus 6 points.
- By asset type, median bridge rates were about 9.75% for retail, 11.5% for hotels, 12.0% for mobile home parks and 11.5% for residential land.
On a two-year loan, 12% interest plus 6 points upfront works out to roughly 15% a year before exit fees. At that cost, a bridge loan only makes sense when the business plan quickly produces a property that can refinance into permanent debt, and today’s permanent market is 7-8%, not 6%.
The backdrop: multifamily stress is building, not easing
Higher rates are arriving while a large share of existing debt is already struggling to refinance.
- Multifamily CMBS delinquency is 7.69% (Trepp, July, and unchanged in August). A year earlier it was 5.44%, and two years earlier 1.84%.
- 8.37% of multifamily CMBS loans are with the special servicer (August). Across all CRE, the CMBS special servicing rate is 11.42%, the highest since February 2013.
- Maturity defaults are a large part of the problem. If performing loans that have matured but not paid off are included, July’s CMBS delinquency rate rises to 9.62%, 176 bps above the headline figure.
- Bank data looks better on the surface. Bank-held multifamily delinquency dipped to 1.41% in Q2 from 1.47% in Q1. But 90+ day delinquencies and net charge-offs both rose. CRED iQ describes that pattern as “consistent with a workout-driven cycle rather than a resolving one.”
- The maturity wall is still here. The MBA estimates $875 billion, or 17% of the $5.0 trillion in outstanding commercial and multifamily mortgages, matures in 2026.
Lenders are seeing the same thing in individual deals. One lender active in multifamily described much of the current distress as Sunbelt properties bought or built with floating-rate debt that is now maturing. In many cases the property operates well, but the sponsor can’t refinance at today’s rates and is running out of extensions. In that lender’s words, it’s “a capitalization problem, not an asset problem”. The lender expects more recapitalizations, note sales and forced sellers, and says disciplined buyers are acquiring quality assets 25-30% below comparable trades from two years ago.
Those maturing loans now refinance into a market where both the 5-year and 10-year Treasuries are above 5%.
How to place deals in a 5% Treasury market
- Underwrite at today’s index, not last month’s quote. Size your borrower’s loan at the current 5-year Treasury plus 275-350 bps for bank and credit union debt, on 20-25-year amortization at 1.25x DSCR. If the deal only works at 6.4% on a 30-year schedule, it doesn’t work today, and it’s better your borrower hears that from you than from a lender.
- Shop the same deal widely, because pricing varies a lot between lenders. On one Kansas single-family rental, quotes ranged from 7.00% at a community bank to above 8.25% at a credit union, a spread of more than 125 bps on the same property. On a Louisiana rental, quotes ran from 7.75% to 8.26%.
- Put your borrower’s relationships to work. Deposits, local guarantors and full banking relationships are now pricing tools, and several lenders tied lower pricing to deposits. Ask about them early and bring them to the lender up front, not at the end of the negotiation.
- Reach maturing borrowers early. Borrowers with loans maturing in the next 12-18 months need to start now, and most won’t until someone calls them. Extensions are getting harder to get and proceeds are shrinking, so the broker who reaches them first gets the most time to find a workable structure.
- Compare the whole term sheet for your borrower. Look at exit fees, prepayment structures, brokered-loan surcharges and points along with the coupon. A lower rate with a 2.5% exit fee or 6 upfront points may cost more than a higher rate without them.
One Virginia retail purchase drew quotes from 6.35% to 13.90%. That gap is bigger than anything Treasuries did all year, and it’s why getting the deal to the right lenders matters more than waiting for rates to come down.
LoanBase matches your deals with 7,500+ active lenders, from credit unions and community banks to debt funds and bridge lenders. Submit a deal and compare live quotes.

